Mat has updated the DIY Heatmaps for EMC CLARiiON and VNX arrays to version 3.021. You can get it from the Utilities page here. Any and all feedback welcome. Changes below:
Add command line options:
–min_color –mid_color –max_color
To allow the user to select different color schemes for their heatmap graphs. The available colors to choose from are (red, green, blue, yellow, cyan, magenta, purple, orange, black, white)
–steps
Change the granularity of the heatmap steps, for example on an attribute like % Utilization, if steps is set to 20, there will be different color bands for 0-4%, 5-9%, 10-14%,etc the default is 10 so color bands will be at 0-9%,10-19%,20-29%, etc
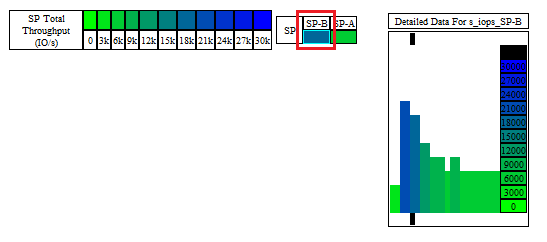
–detail_data
This option will allow you to display detail heat graph for an object over time when it has been selected. For example, selecting the SP-B heatmap object below, produces a heat graph for that object over the duration of the NAR file. Thanks to Ian for the idea and code behind this.
There have been some other script improvements that:
Add exit code checking after running naviseccli
Browser compatibility fixes – mainly with Chrome, but this should improve display consistency across different browser platforms
